Creating reusable, scalable foundations for data experiences across GitLab
Challenges
Multiple teams at GitLab were building data visualization features independently, creating inconsistent user experiences and duplicated effort. Additionally, our static dashboards suffered from low adoption due to technical limitations. Users couldn’t aggregate data across organizational boundaries or create custom views for their specific needs.
My role
- I lead the effort for creating new dashboard specific guidelines and updates to the data visualization library components
- Participated in customer calls with my PM to understand customer painpoints and needs
- Closely collabrated with designers from other product areas that were working on presenting data in their designs
- Held dashboard framework office hours to promote new dashboard framework adoption
Approach
Understanding the systemic problems
I identified two interconnected issues limiting data adoption:
- Technical constraints: Data access was tied to GitLab’s nested group structure rather than user permissions, preventing cross-team analysis
- Missing foundations: Each team was building custom UIs without shared patterns or components
Rethinking the data access model
I worked with Product and Engineering to map out the existing system constraints. The core issue, customers couldn’t roll up metrics across teams they managed unless those teams shared a parent group in the application hierarchy.
I designed a solution that separated data access from application structure, enabling:
- Permission-based data access at the organization level
- Self-service dashboard creation, customization, and sharing
- Flexible aggregation across GitLab’s group structure
Building cross-product foundations
Simultaneously, I led an effort to establish shared data visualization patterns. I collaborated with designers from other groups building similar features, conducting a pattern audit to understand common needs and use cases.
Collaborating on technical feasibility
I partnered closely with engineers to understand the constraints of our query language (GLQL) and what extensions would be needed to support visualization rendering. I also worked with frontend engineers to ensure Figma components matched GitLab-UI implementations, reducing design-to-development friction.

Examples of inconsistencies
Solution
Dashboard Framework:
- Permission-based data access enabling cross-team analysis
- Self-service dashboard builder for creating, saving, and sharing custom views
- Extended GLQL to support data visualization rendering

Dashboard creation flows
Design System Contributions:
- Comprehensive guidelines for data presentation and dashboard interaction patterns (filtering, drill-downs, settings, exporting, sharing)
- Standardized components available in both Figma and GitLab-UI
- Documentation and best practices for creating better data stories for designers and engineers across the organization

Dashboard filtering guidelines

Dashboard panel guidelines

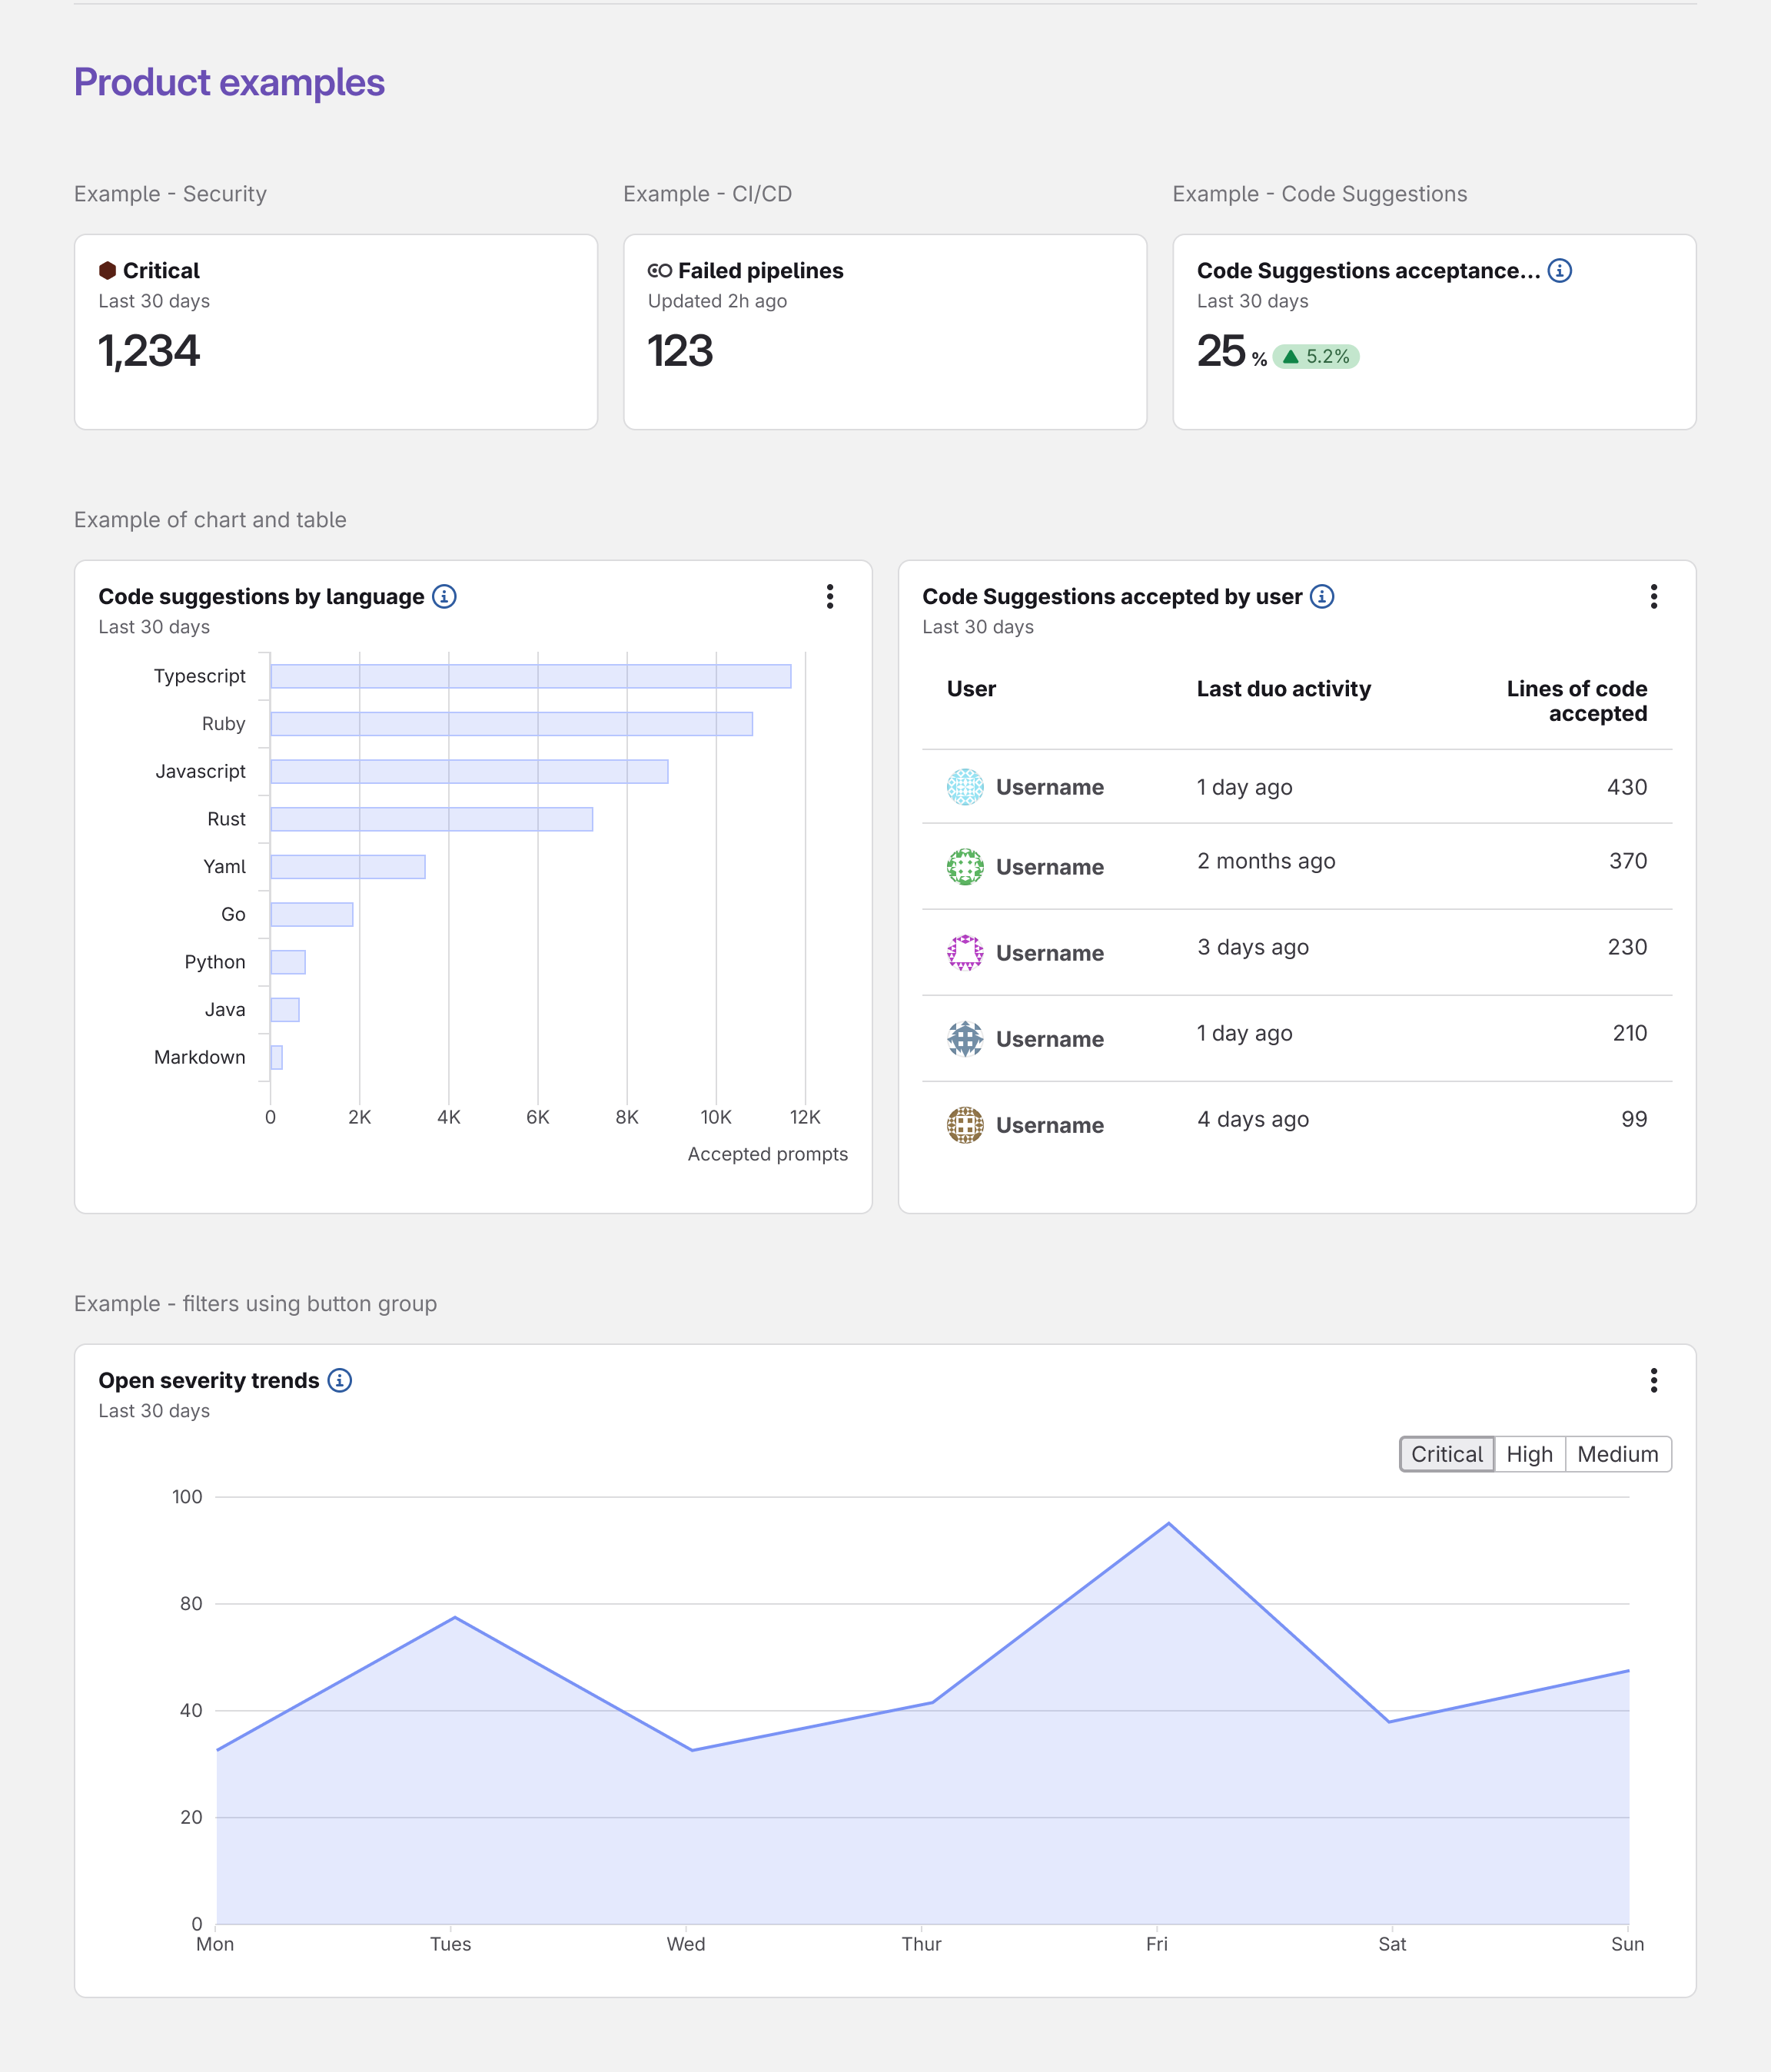
Single stat component example
Outcomes
- Scaled efficiently: Multiple teams could now implement data features faster using shared components and patterns
- Increased adoption: Flexible dashboards met diverse user needs across different teams and workflows
- Improved consistency: Product-wide visual and behavioral consistency increased customer confidence
- Reduced costs: Internal teams consolidated onto GitLab instead of using third-party BI tools
- Established ownership: Became code owner for data visualization section of GitLab’s design system
- Enabled collaboration: Created horizontal solutions that serve multiple business verticals and personas
Key Insight
By creating shared infrastructure and patterns, we enabled multiple teams to move faster while delivering a more coherent experience across the entire platform. The framework accommodates diverse workflows rather than prescribing a single approach.